公路车道检测。
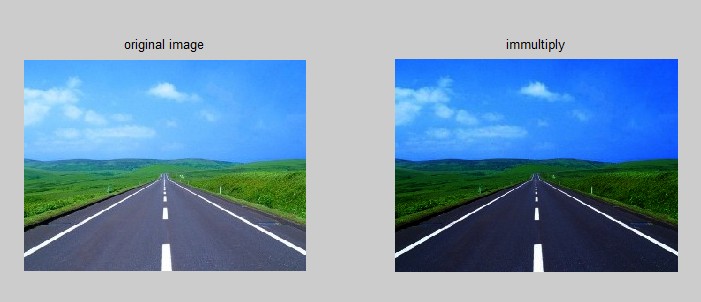
1、原始图 与 叠加后
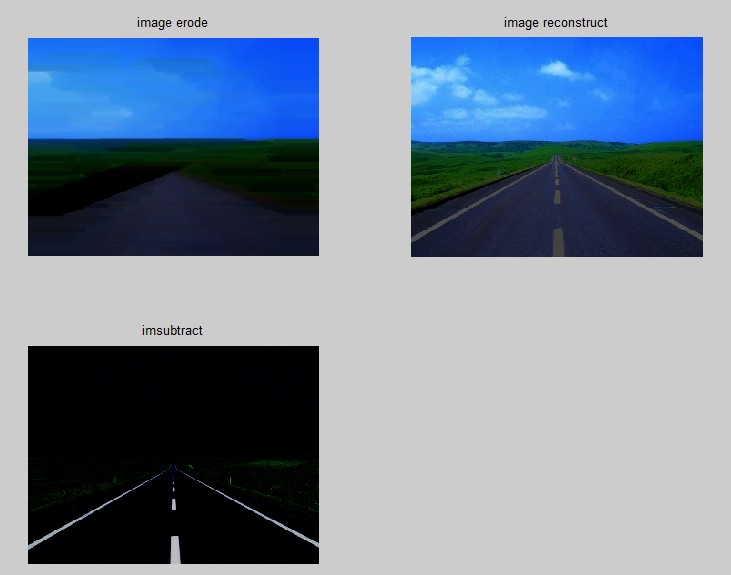
2、腐蚀、重构 与 相减
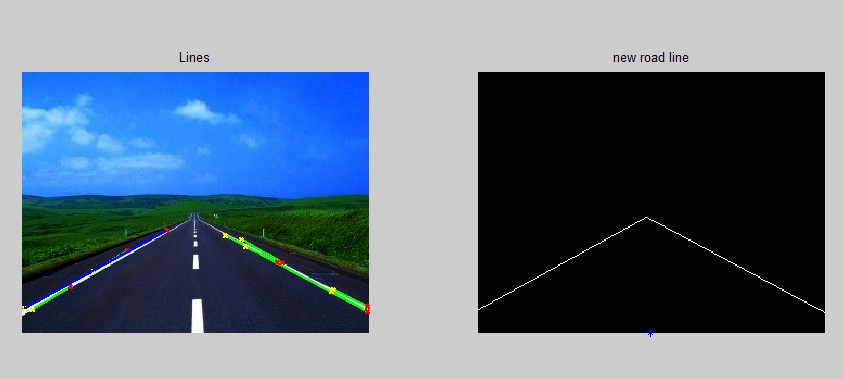
3、霍夫变换检测线上色、根据直线方程绘制新图
4、坐标系绘制曲线
由于图片读取的坐标系是第四象限,而绘制曲线是第一象限,所以两图关于 x 轴对称。
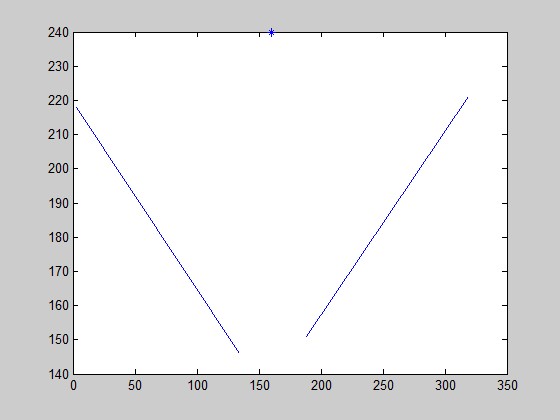
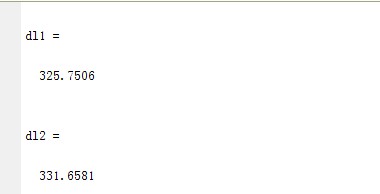
5、计算得到的 '*' 点(160, 240)到两条直线的垂直长度
6、Codes
1
2
3
4
5
6
7
8
9
10
11
12
13
14
15
16
17
18
19
20
21
22
23
24
25
26
27
28
29
30
31
32
33
34
35
36
37
38
39
40
41
42
43
44
45
46
47
48
49
50
51
52
53
54
55
56
57
58
59
60
61
62
63
64
65
66
67
68
69
70
71
72
73
74
75
76
77
78
79
80
81
82
83
84
85
86
87
88
89
90
91
92
93
94
95
96
97
98
99
100
101
102
103
104
105
106
107
108
109
110
111
112
113
114
115
116
117
118
119
120
121
122
123
124
125
126
127
%% clean command window
clc
%% original road image
% road image: 320 x 240
I = imread('img.jpg');
figure;
subplot(121), imshow(I);
title('original image');
%% im2double
% im2double 将图片转化为 double 类型的矩阵
% immultiply 图片相乘,使色彩强度增加
di = im2double(I);
I = immultiply(di, di);
subplot(122), imshow(I);
title('immultiply')
%% erode and recon
% 腐蚀与重构
% 将原图与重构的图片相减,能够过滤背景中的大部分信息
z_erode1 = imerode(I, ones(4,71));
z_recon1 = imreconstruct(z_erode1, I);
newI = imsubtract(I, z_recon1);
figure;
subplot(131), imshow(z_erode1);
title('image erode');
subplot(132), imshow(z_recon1);
title('image reconstruct');
subplot(133), imshow(newI);
title('imsubtract');
%% hough
% candy edge
% 霍夫变换 candy 边缘检测法
BW = edge(im2bw(newI), 'canny');
[H, T, R] = hough(BW);
% peaks in hough
%figure,imshow(H, [], 'XData', T, 'YData', R, 'InitialMagnification', 'fit');
%xlabel('\theta'), ylabel('\rho');
%axis on, axis normal, hold on;
P = houghpeaks(H, 5, 'threshold', ceil(0.3*max(H(:))));
x = T(P(:,2));
y = R(P(:,1));
%plot(x, y, 's', 'color', 'white');
lines = houghlines(BW, T, R, P, 'FillGap', 5, 'MinLength', 7);
figure;
subplot(121),imshow(I), hold on;
title('Lines');
max_len = 0;
% 为霍夫变换提取的直线上色
for k = 1:length(lines);
xy = [lines(k).point1; lines(k).point2];
plot(xy(:,1), xy(:,2), 'LineWidth', 2, 'Color', 'green');
plot(xy(1,1),xy(1,2),'x','LineWidth',2,'Color','yellow');
plot(xy(2,1),xy(2,2),'x','LineWidth',2,'Color','red');
len = norm(lines(k).point1 - lines(k).point2);
Len(k) = len;
if (len > max_len)
max_len = len;
xy_long = xy;
end
end
plot(xy_long(:,1),xy_long(:,2),'LineWidth',2,'Color','blue');
%% Get two longest line
% L1 L2
% 获取两条最长的直线
[L1 Index1]=max(Len(:));
Len(Index1)=0;
[L2 Index2]=max(Len(:));
x1=[lines(Index1).point1(1) lines(Index1).point2(1)];
y1=[lines(Index1).point1(2) lines(Index1).point2(2)];
x2=[lines(Index2).point1(1) lines(Index2).point2(1)];
y2=[lines(Index2).point1(2) lines(Index2).point2(2)];
%% Slope of line
% L1 -> K1; L2 -> K2
% 直线斜率
K1=(lines(Index1).point1(2)-lines(Index1).point2(2))/(lines(Index1).point1(1)-lines(Index1).point2(1));
K2=(lines(Index2).point1(2)-lines(Index2).point2(2))/(lines(Index2).point1(1)-lines(Index2).point2(1));
%% redraw a new image to show the road line
% 重绘一张图,用 zeros 将置全黑
[m,n] = size(BW); % 尺寸 m = 240, n = 320
BW1=zeros(m,n);
b1=y1(1)-K1*x1(1);
b2=y2(1)-K2*x2(1);
% 两次遍历图片上的点,若与直线 y1 y2重叠的点,则置1(即绘白色)
% round to get the line
% 第一次,对点四舍五入取整
for x=1:n
for y=1:m
if y==round(K1*x+b1)|y==round(K2*x+b2)
BW1(y,x)=1;
end
end
end
% ceil to get the line
% 第二次,对点直接舍弃小数点取整
for x=1:n
for y=1:m
if ceil(K1*x+b1)==ceil(K2*x+b2)
y3=round(K1*x+b1);
BW1(1:y3-1,:)=0;
end
end
end
% 两次绘点能够更好地绘制直线
subplot(122), imshow(BW1), hold on;
title('new road line');
plot(n/2, m, '*');
%% Vertical distance of point to the line
% 点(160,240)到两条直线的垂直距离,即摄像头到线的距离(假定摄像头近似贴近路面)
figure, plot(x1, y1), hold on;
plot(x2, y2);
plot(n/2, m, '*');
dl1 = abs(K1*(n/2) + m + b1)/sqrt(K1^2 + 1)
dl2 = abs(K2*(n/2) + m + b2)/sqrt(K2^2 + 1)
© 2014 plinx